Article: Intel® D975XBX EPP [Extreme Performance Profile]? (Uber Motherboard for Intel® Core™-based Processor)
(N=Newbie, E=Hardware Enthusiast, O=Overclocker, B=Budget)
V. Findings

So laying down the data again:
-
Unstable FSB overclocking:
- Bootstrap 1066MHz (266MHz FSB cold boot)
- 3.63GHz (11 x 333MHz)
- Divider 1:1 ratio (RAM tested to run at DDR2-700MHz+)
-
Rockstable Multiplier overclocking:
- Bootstrap 1066MHz (266MHz FSB cold boot)
- 3.72GHz (14 x 266MHz)
- Divider 1:1 ratio (RAM tested to run at DDR2-700MHz+)
If an overclock on X6800 (266x11) with 333x11 (3.66GHz) will quickly fail with all settings on default, but rock stable at 266x14 (3.72GHz) and the motherboard is also stable on different processors E6300 (333x7=2.33GHz) and E6700 (333x9=2.99GHz), could it be that the motherboard is playing tricks?
At first, I dismissed it and blame it on my "noobie-ish" overclocking a processor based on new uA, but it is becoming more and more obvious as I progress doing more tests. Recording settings on stock, comparing it with FSB overclocking and multiplier overclocking reveals a startling findings:
The motherboard is changing the vCore everytime multiplier is adjusted!
VI. Some more analysis
Though I have seen such vCore auto-adjustment in some motherboards, I have never seen anything that kind of adjustment in an almost linear fashion across different multiplier. However, this board actually raised vCore with multiplier increase.
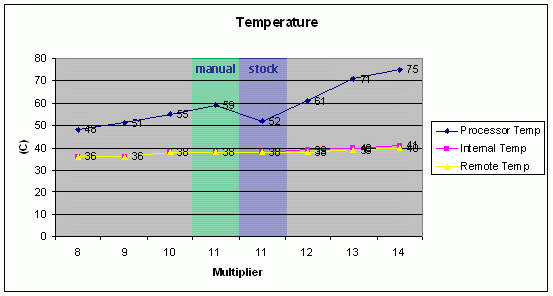
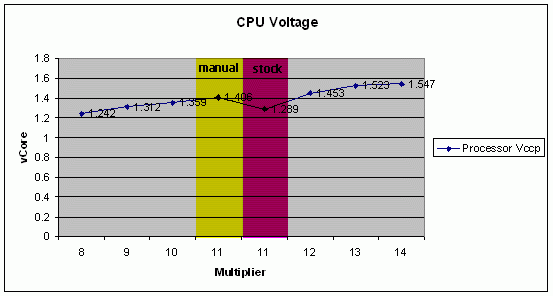
Having said that, this is why I have two 11x in the graph, one is manually set and one is on stock. The stock one with 11x will be the middle baseline comparison for all this multiplier changes. The multiplier will be changed from 8x to 14x, with the stock 11x representing the exact middle baseline for the high overclock and low underclock.
Temperature Increase (Click image for bigger picture)

To further verify voltage increase, I used the the motherboard utility and checked the temperature readout. I also use the BIOS Hardware monitoring and compare the increase in vCore values as well as the temperature increase. It is interesting to note that the processor which runs on the same frequency with just an option changed (i.e. Burn In feature enabled, but all settings still on default) will produce such a disparity in temperature. The one with lowest multiplier has the least temperature readout.
And the last test I did is to run this system in both "auto" settings as well as "manual multiplier" change but I am not changing any of the multiplier nor any settings except I enable OCing function. In this board, it is important to know that the Burn-In feature needs to be enabled first, since the options are "gray" out if disabled i.e. options are un-selectable and values are un-changeable. Then enabling the Burn-In features will then make the options selectable and values are changeable, however, the default values are similar to that when the feature is disabled i.e. all values are still on stock but can now be tweaked.
Vcore Increase (Click image for bigger picture)

From the graph above, it shows that this motherboardhas adjusted the vCore automatically whenever there is a change in multiplier. The graph shows that when Burn In mode is left on stock, vCore is a measly 1.28v while making a manual change to 11x pushed the vCore to a whopping 1.4 readout. The seemingly linear increase in vCore is consistent all through out the tested multiplier settings
And of course, the litmus test for all this findings is to run the failing FSB overclocking.
-
FSB overclocking:
- Bootstrap 1066MHz (266MHz FSB cold boot)
- 3.63GHz (11 x 333MHz) vCore adjusted to reflect 14 x 266 settings
- Divider 1:1 ratio (RAM tested to run at DDR2-700MHz+)